Synthetic Iris Dataset
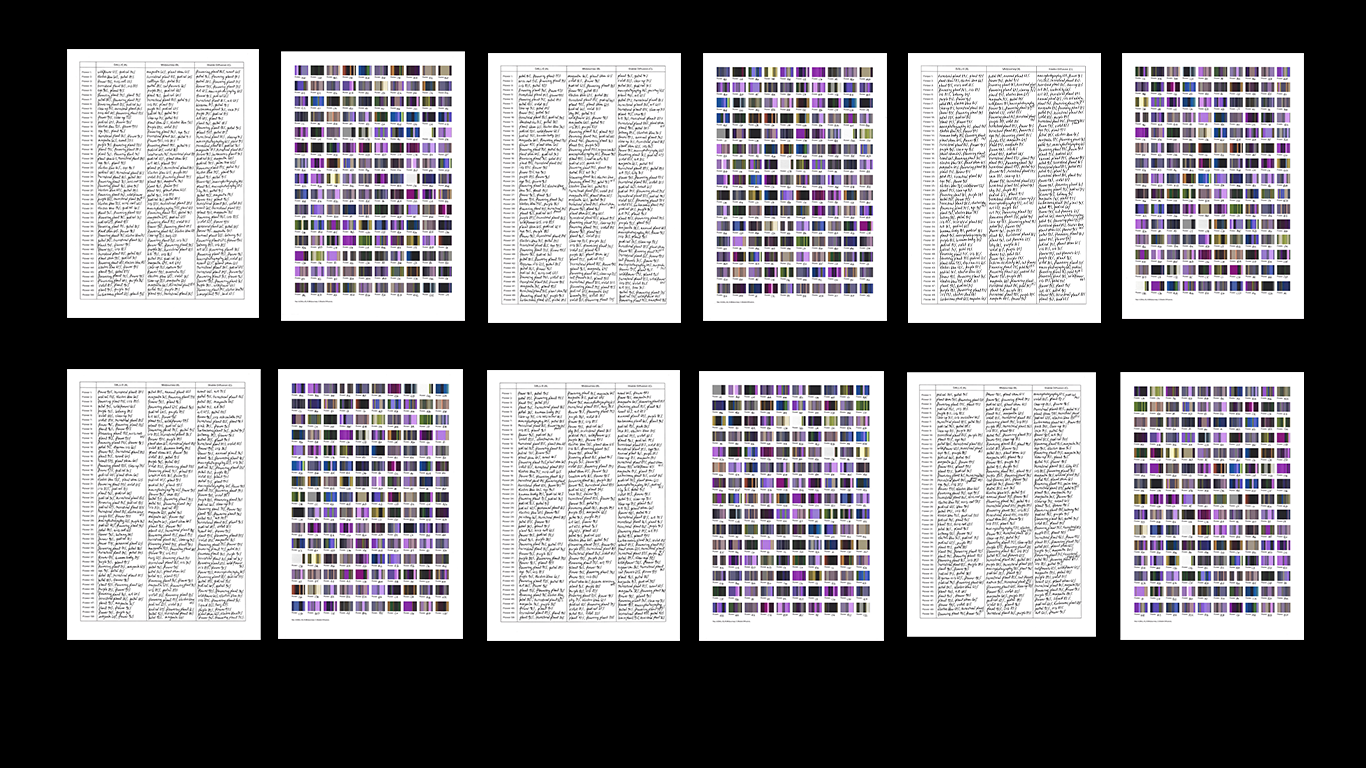
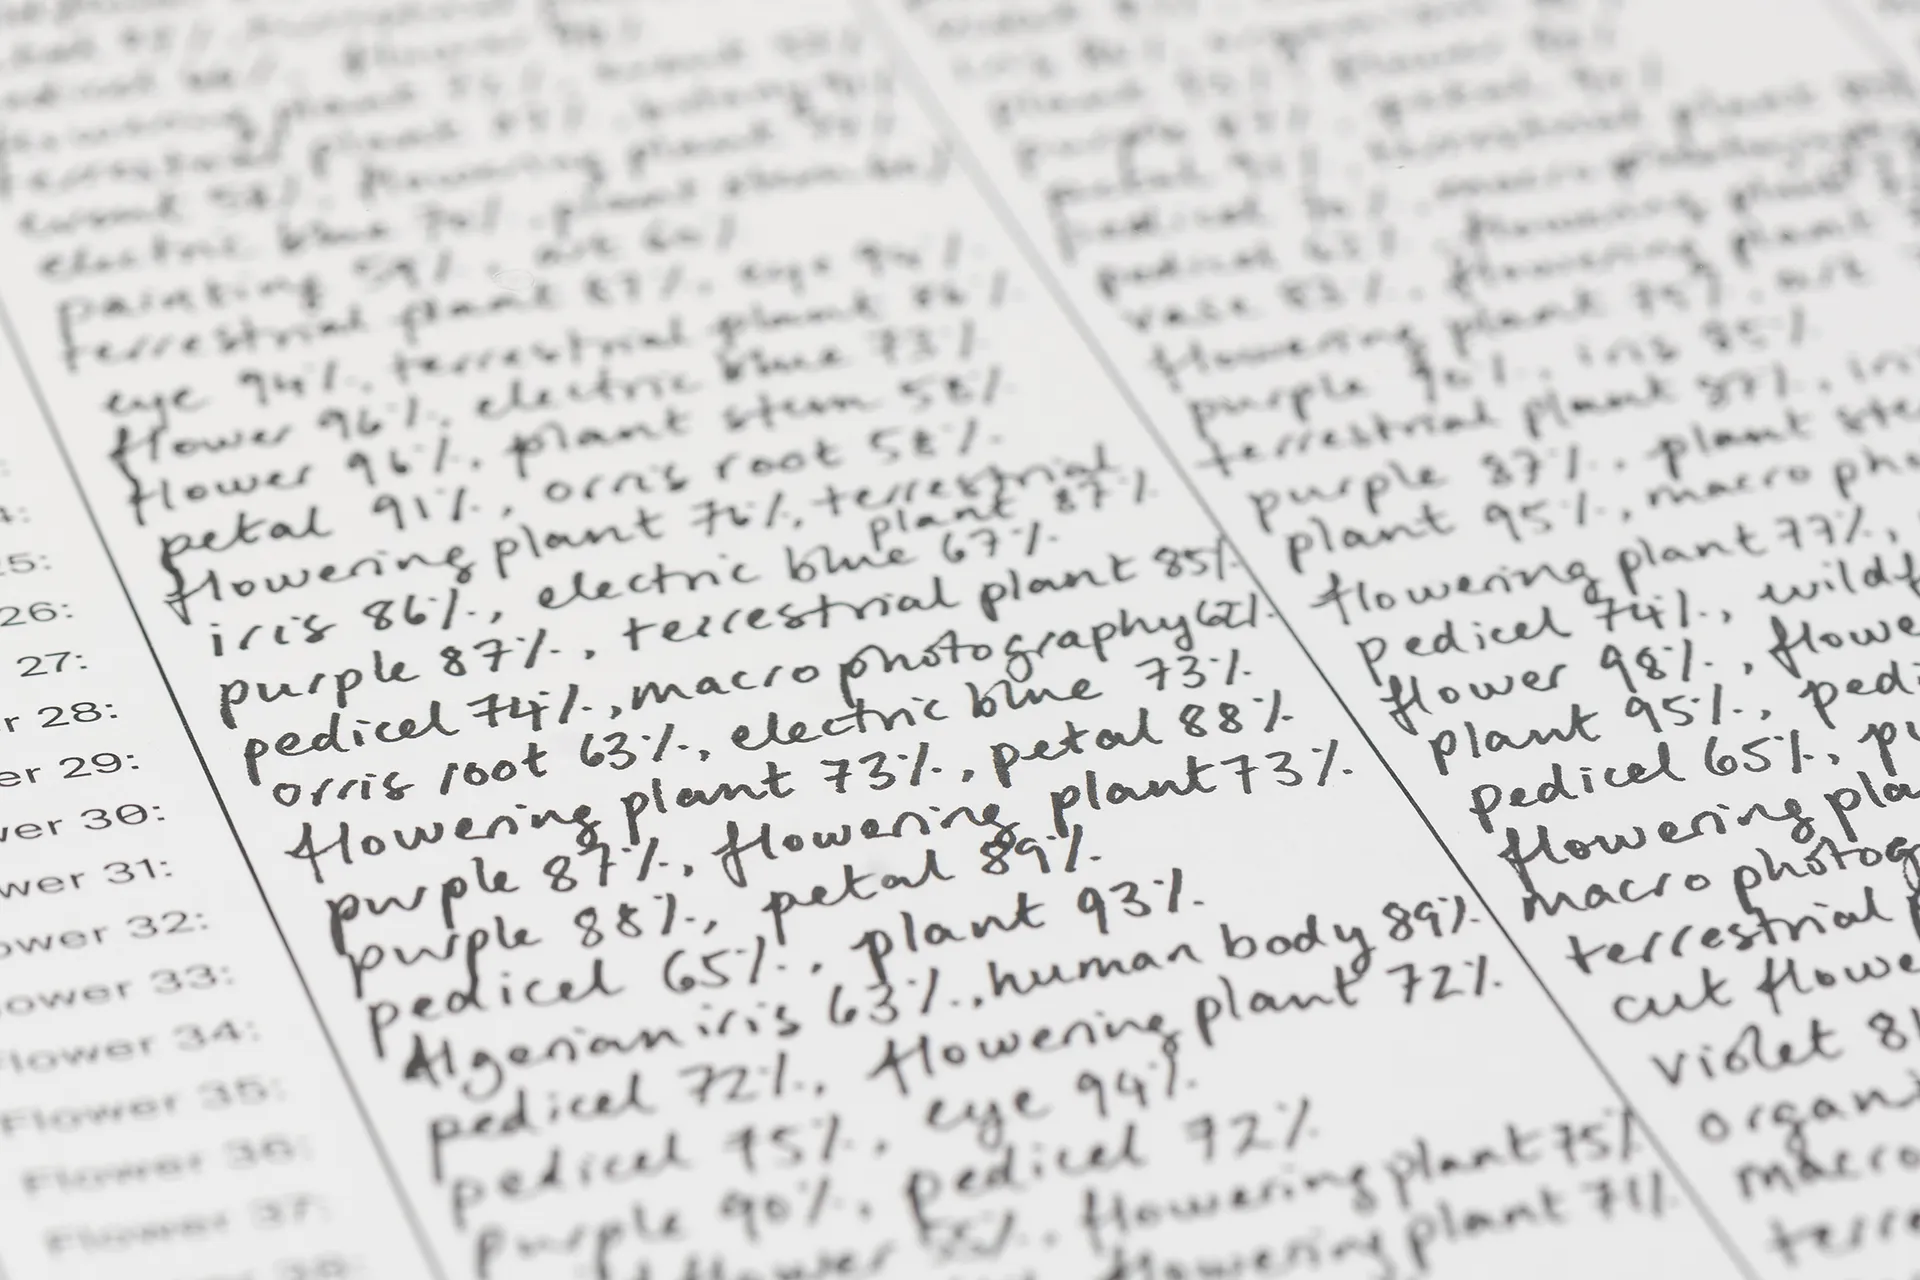
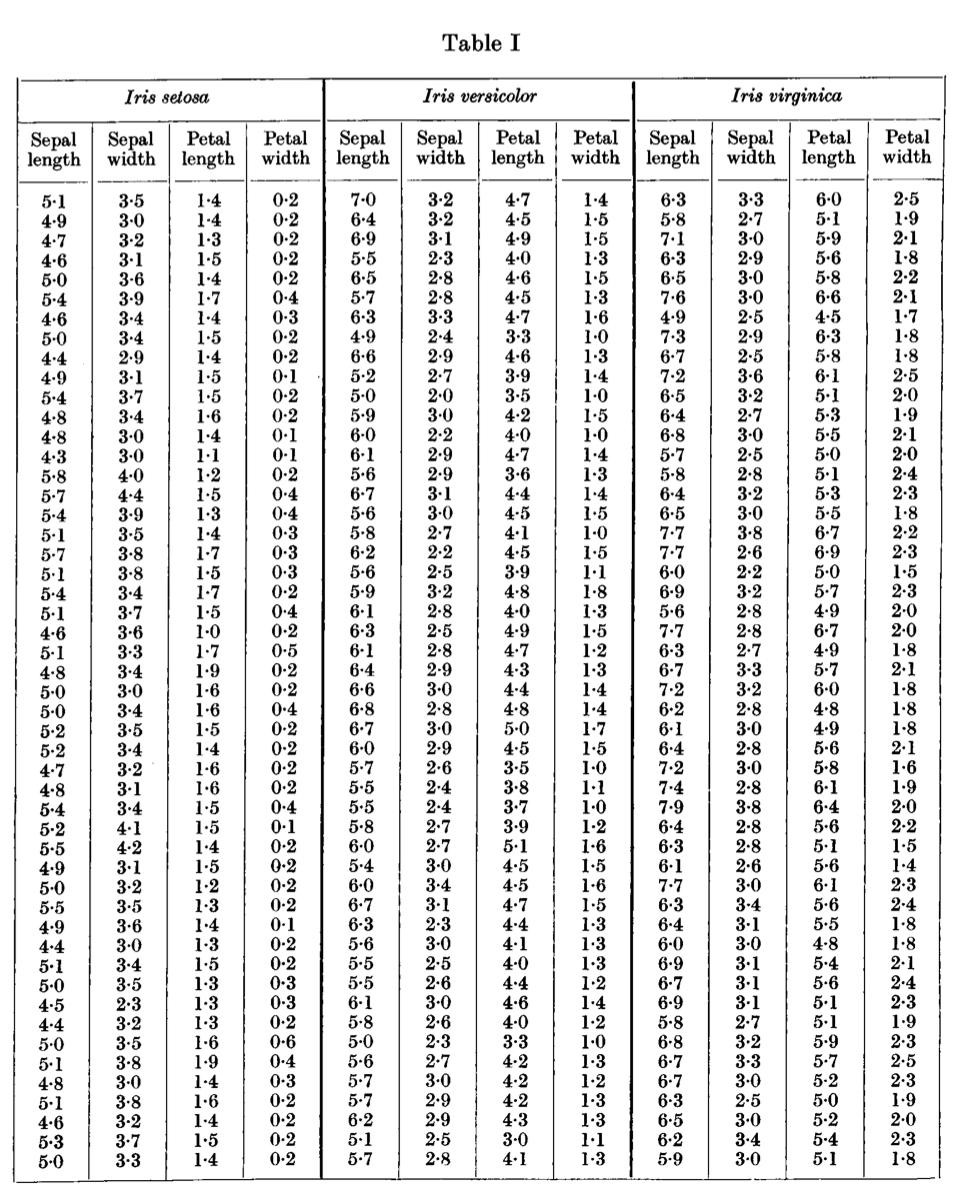
Flower datasets are and always will be, a core part of my work. Synthetic Iris Dataset is a series of prints and handwritten charts of computer vision responses to 150 iris flower images generated using the same prompt across different text-to-image generators, of varying degrees of iris-ness. Irises were a deliberate choice: the original iris dataset was created in the 1930s by Ronald Fisher, abstracting 150 irises found in the same field in Canada into a series of numbers. It is now widely used as a test case for many statistical classification techniques in machine learning and is included in the package scikit-learn. Each time it is downloaded, so is the iris dataset. Thousands of little iris datasets exist now on thousands of computers. The first part describes the attributes of synthetic flowers as seen by a computer vision model and gives a score of how confident it is. Some of these appear reasonable – flower, petal – while others are less so – sky, event. It is also clear that language has muddied things in the dataset at some point. Iris has two meanings in English: the flower and the coloured centre of the eye. Violet indicates both a pigment and the flower. Eyes and colours keep being seen by the API where there are none. The second part shows the colours of the 150 synthetic flowers generated. The problem of the communication of colour has always been difficult. Swedish botanist Carl Linnaeus openly opposed using colour in describing plants because of its inherent subjectivity. Some of the colours that were found using image classification in part 1 do not seem to appear here ("magenta", "electric blue"). This is partially due to the model mis-seeing what is in the image, but it is further heightened by the translation of the RGB colours into the CYMK and the inherent difficulty of rendering the digital accurately in the real world. This project is in many ways an inverse of the dataset I usually create: rather than me trying to teach a machine what should be in the image based on my own photographs, this is trying to parse what a machine sees in an image generated by a machine.
Artist Notes (Thoughts & Process)
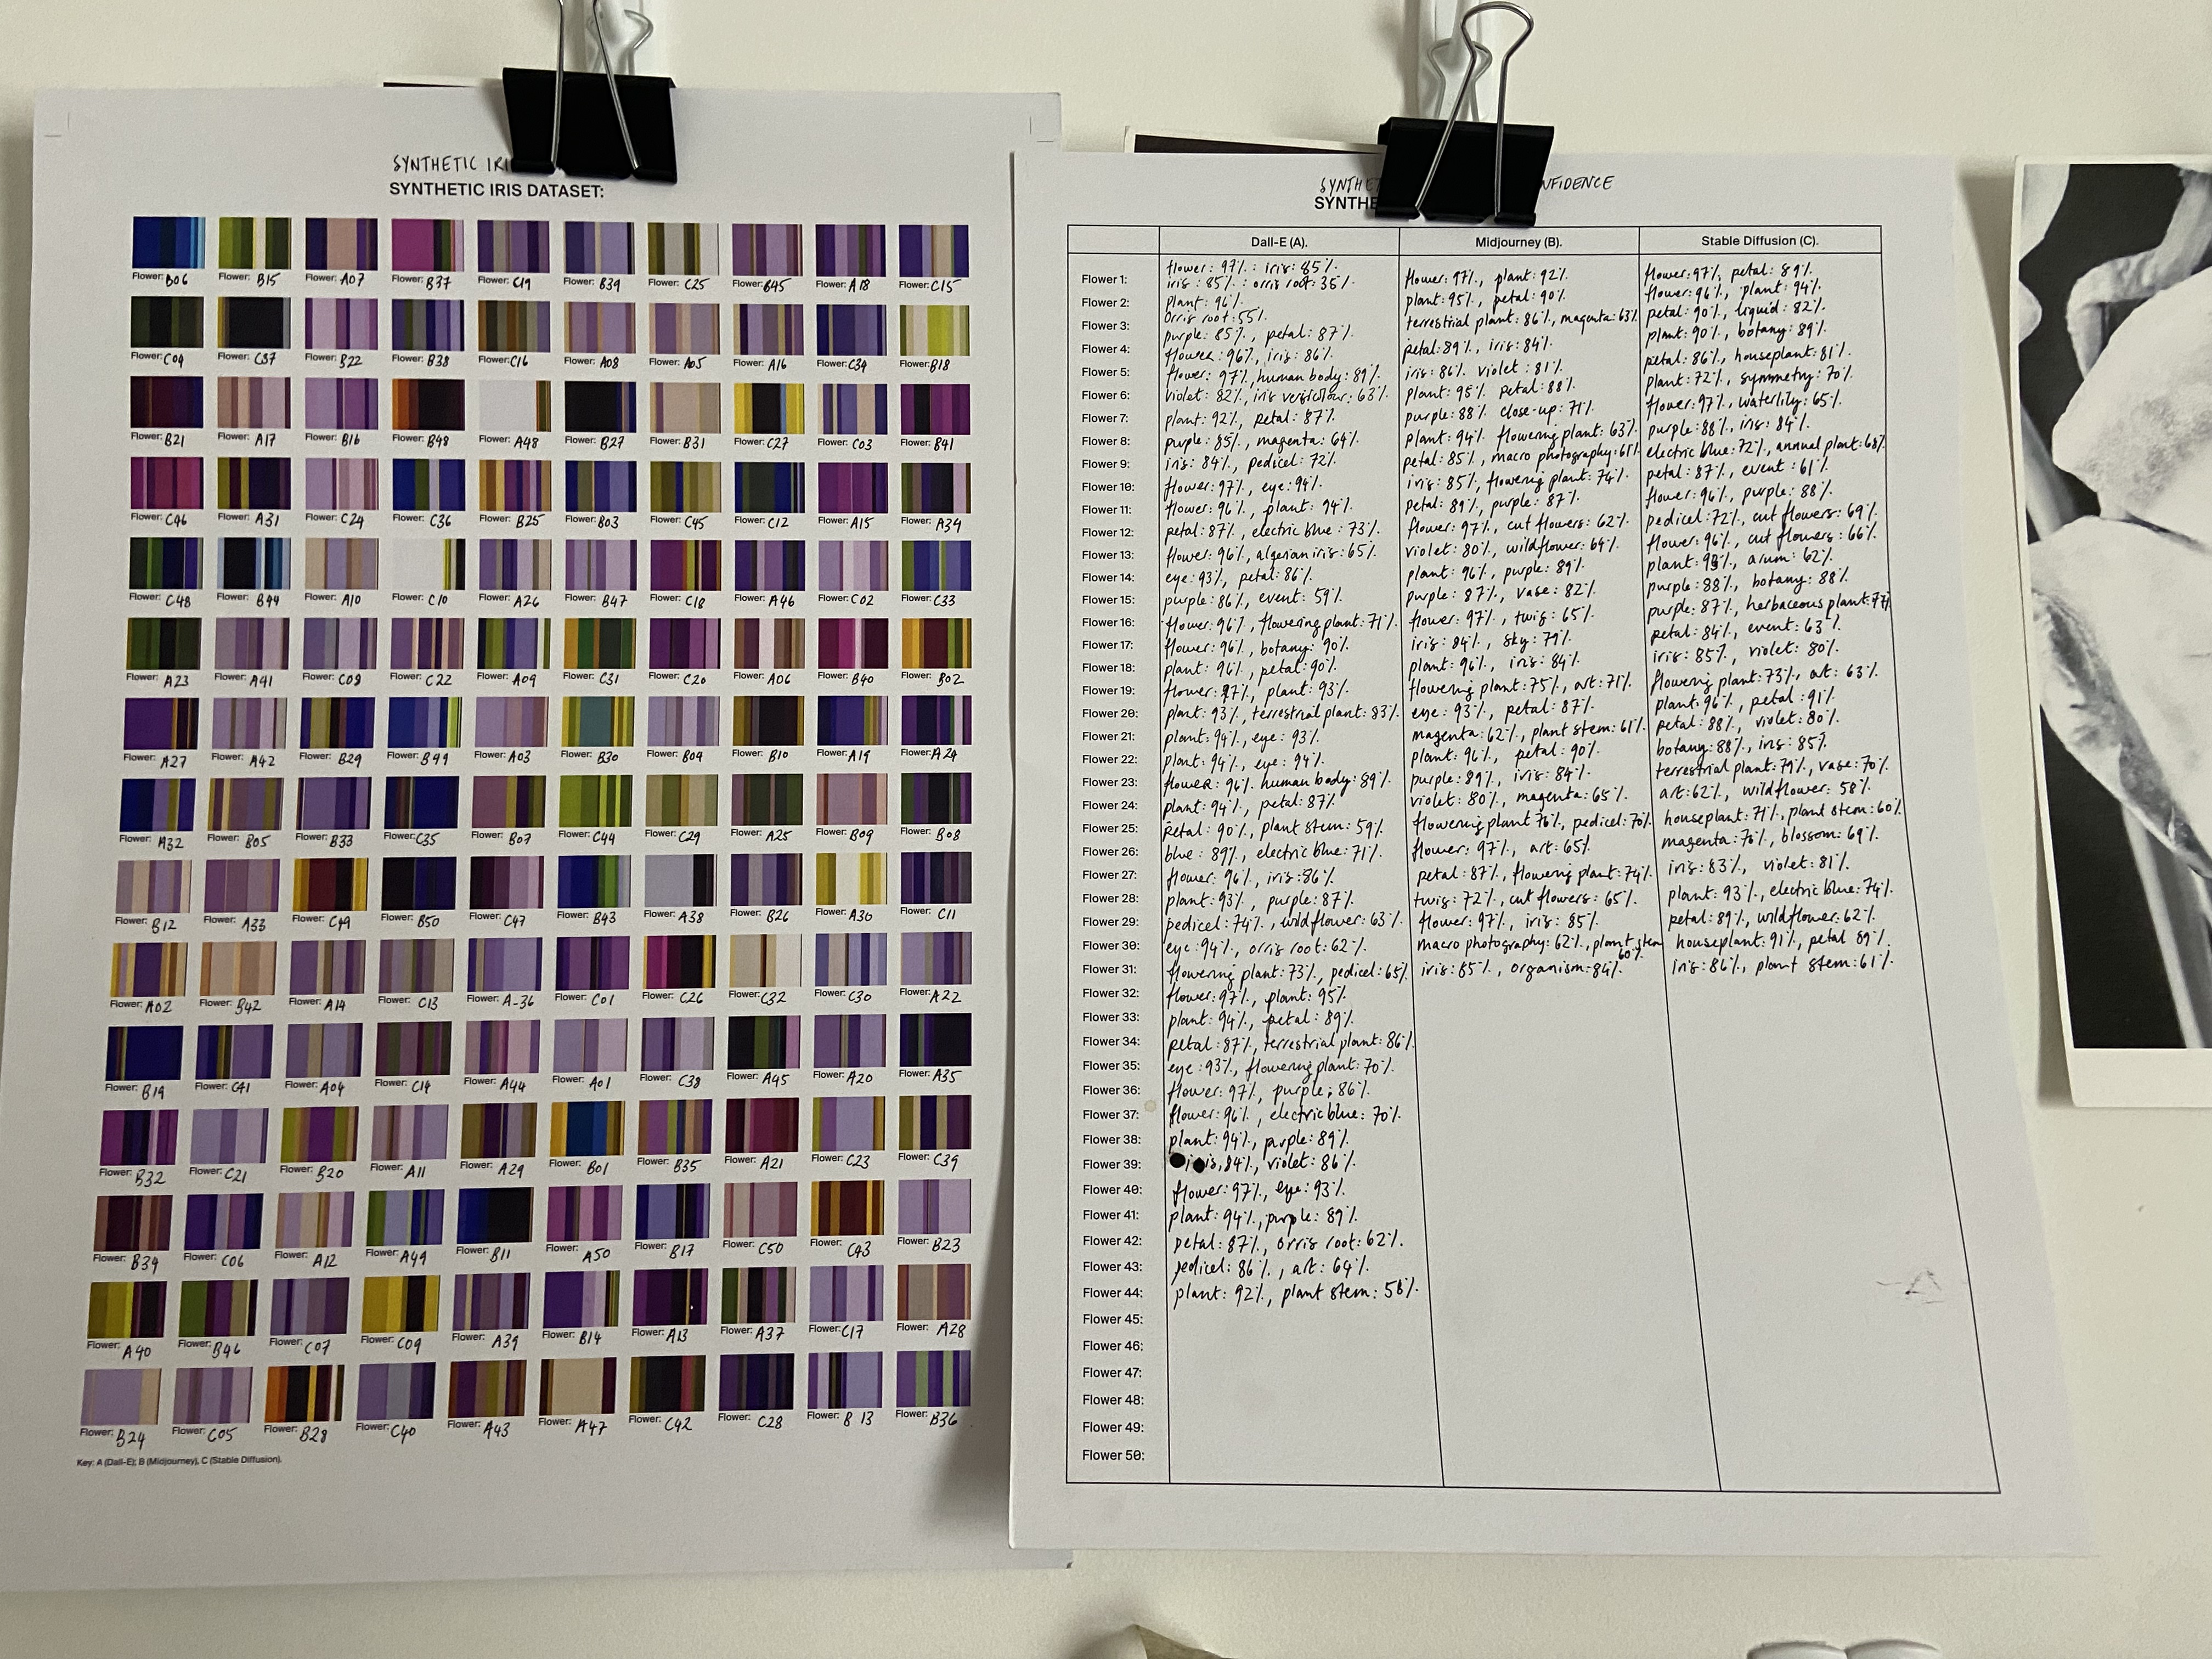
Flower datasets are and always will be, a core part of my work. In 2023 I made a body of work called Synthetic Iris Dataset: a series of prints and handwritten charts of computer vision responses to 150 iris flower images generated using the same prompt across different text-to-image generators, of varying degrees of iris-ness. Irises were a deliberate choice: the original iris dataset was created in the 1930s by Ronald Fisher, abstracting 150 irises found in the same field in Canada into a series of numbers. It is now widely used as a test case for many statistical classification techniques in machine learning and is included in the package scikit-learn. Each time it is downloaded, so is the iris dataset. Thousands of little iris datasets exist now on thousands of computers. The first part describes the attributes of synthetic flowers as seen by a computer vision model and gives a score of how confident it is. Some of these appear reasonable – flower, petal – while others are less so – sky, event. It is also clear that language has muddied things in the dataset at some point. Iris has two meanings in English: the flower and the coloured centre of the eye. Violet indicates both a pigment and the flower. Eyes and colours keep being seen by the API where there are none. The second part shows the colours of the 150 synthetic flowers generated. The problem of the communication of colour has always been difficult. Swedish botanist Carl Linnaeus openly opposed using colour in describing plants because of its inherent subjectivity. Some of the colours that were found using image classification in part 1 do not seem to appear here (“magenta”, “electric blue”). This is partially due to the model mis-seeing what is in the image, but it is further heightened by the translation of the RGB colours into the CYMK and the inherent difficulty of rendering the digital accurately in the real world. This project is in many ways an inverse of the dataset I usually create: rather than me trying to teach a machine what should be in the image based on my own photographs, this is trying to parse what a machine sees in an image generated by a machine.
Exhibition Venues
Featured In
References and Inspiration
Dissemination
This is an series of 20 charts and diagrams (part A and part B) and 5 artist's proofs.